

What does police data tell us about safety? and what does it leave out?
Bristol safety, part two

In the previous article, I looked at where people feel the safest during the day and during the night.
In the following areas in Bristol, nearly everyone feels safe during the day.
Redland 99%
Clifton 98.3%
Clifton Down 98%
Cotham 98%
The top four safest-feeling places during the night were as follows:
Clifton Down 88.9%
Clifton 85.1%
Stoke Bishop 84.4%
Westbury-on-Trym & Henleaze 83.7%
Is a subjective measure such as how people ‘feel’ good enough for a conclusion to be made about actual safety? How we feel might vary depending on a wide range of factors. Older people might have a different tolerance for risk, and white young men might have a much higher one. We don’t all inhabit the same worlds when it comes to safety and danger.
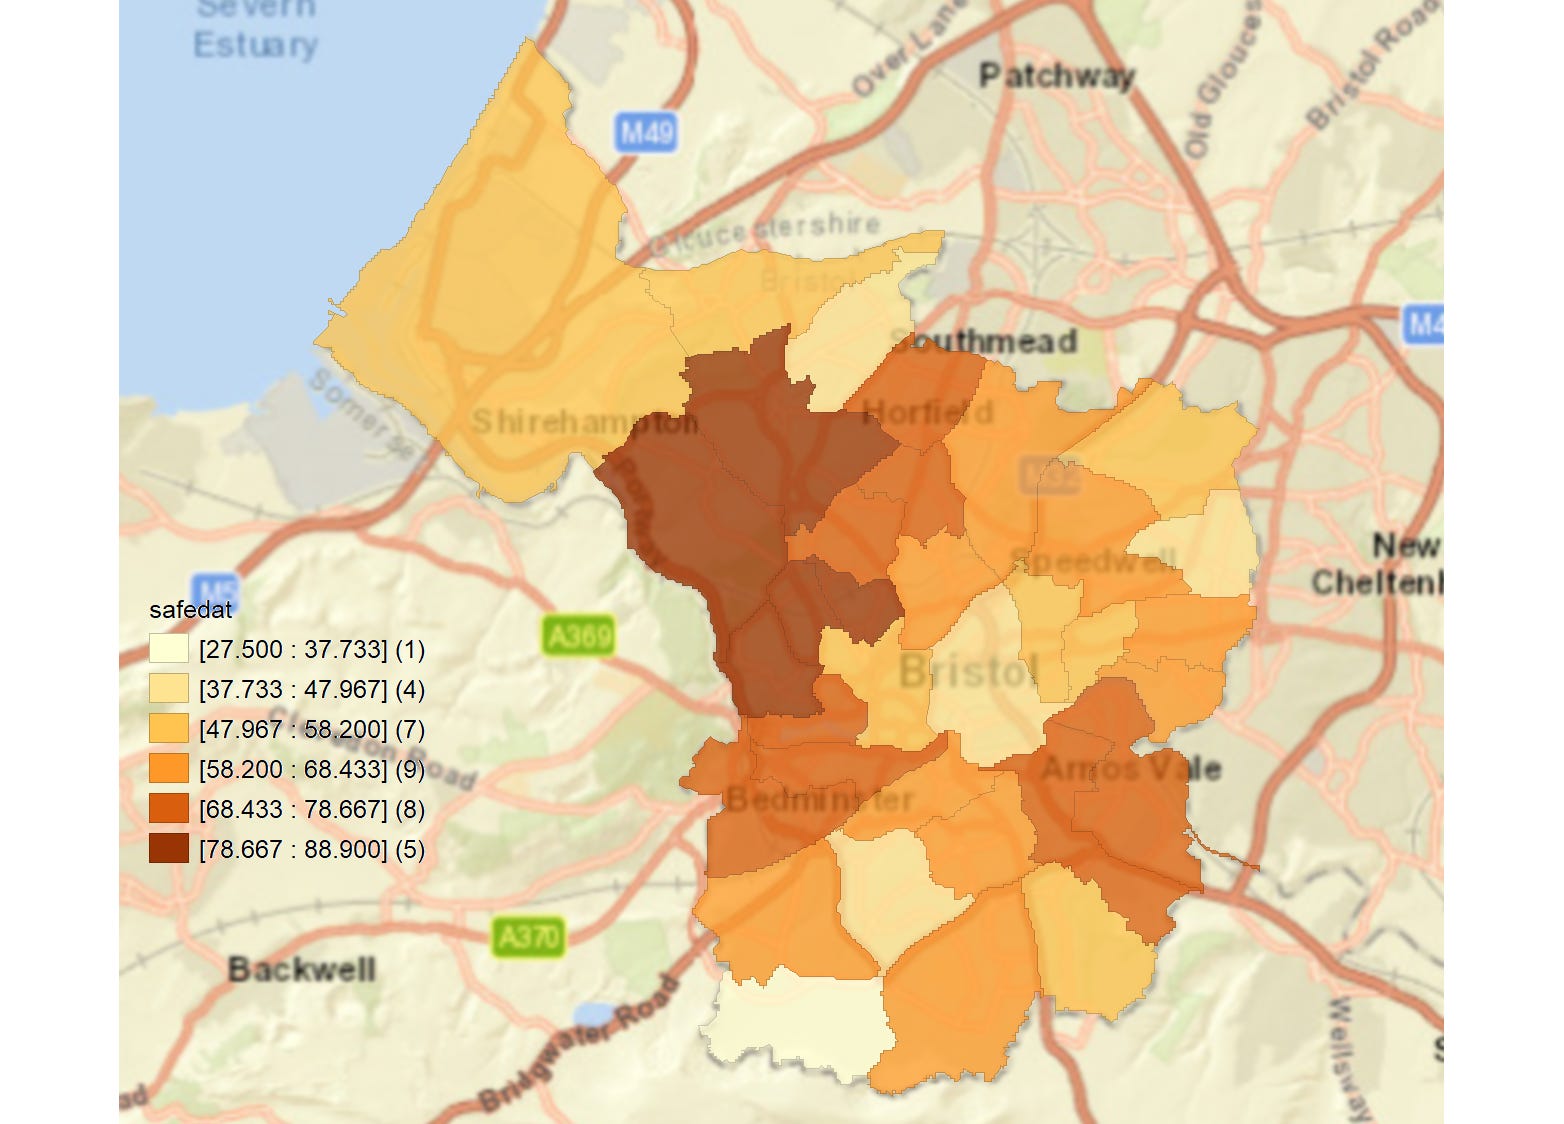
I am, therefore, bringing in an additional measure to add some validity or context to the results. The following map has been created based on Avon and Somerset police crime data. The lighter areas show low numbers of offences, and the darker colours show the opposite. Central ward, for example, has the highest number of offences at 239 per 1000 population, while Harbourside and Hotwells comes second at 190.

The offences in Central ward are dominated by violence and sexual offences, anti-social behaviour, and theft. This could arguably reflect the cluster of night time leisure activities in the city centre compared to other areas in Bristol.
Over the past three years, there have been over 3000 instances of anti-social behaviour in the city centre, which will have included the Bristol protests, and 2753 instances of violence and sexual offences. Altogether there were 11,371 offences.
You can see breakdowns of offences on the Avon and Somerset Police website. Hartcliffe and Whitchurch had 9735 offences over three years, and the top offences there were primarily violence and sexual offences followed by anti-social behaviour.
When looking at the data of how people felt, however, Central ward as reported by residents, didn’t feel as unsafe say as Hartcliffe and Withywood (H&W), even though it had the highest number of offences recorded.
One explanation for this disparity could be that it’s not residents being arrested in the city centre. Many people travel in from other parts of the city and this place that some of us call home, becomes much more of a public area. That’s the way it is with city centres.
One thing that is confirmed is that there have been far fewer offences in Clifton Down, rated as the safest place at night in the Quality of Life survey, at 2453 offences over three years. This is almost five times fewer offences than in the city centre.
That cluster of wards including Clifton, Westbury on Trym and Stoke Bishop, seem to feel safe and be safer for residents.
When looking at a correlation between crime data and feeling safe, however, only about 22% of the variation can be explained. H&W provides quite the outlier.

H&W has the lowest score of feeling safe during the day but a much lower number of offences counted by the police than would be predicted.
Some questions that might arise from this are how much police presence is there in H&W and are incidents not being reported?